Introduction
Matplotlib, while excellent for 2D plotting, is not well-suited for advanced 3D tasks. When creating 3D visualizations in Python, libraries like VTK, PyVista, and Pyvedo are the go-to tools. These libraries are designed specifically for working with 3D data and rendering complex or interactive visualizations.
The Visualization Toolkit (VTK) is a powerful open-source software system for 3D computer graphics, image processing, and scientific visualization. This lecture provides an introduction to VTK, focusing on its use with Python.
What is VTK?
VTK, or the Visualization Toolkit, is an open-source software system widely used for 3D computer graphics, image processing, and scientific visualization. Developed in the 1990s, it is written in C++ but supports bindings for various programming languages, including Python.
There are many libraries and software tools built on top of VTK. Two notable examples are PyVista and pyvedo, which are Python libraries based on this powerful open-source framework for 3D computer graphics, image processing, and visualization. Both libraries simplify working with VTK, making it more accessible to Python developers.
What you can do with VTK
VTK is extremely versatile and supports a wide range of functionalities:
3D Rendering
Render complex 3D geometries, including meshes, surfaces, and volumetric data.
Control lighting, camera angles, textures, and shading.
Generate high-quality images and animations for presentations or research.
Data Visualization
Visualize scientific datasets, including structured grids, unstructured grids, and point clouds.
Apply techniques like:
Contour plots (e.g., isolines or isosurfaces).
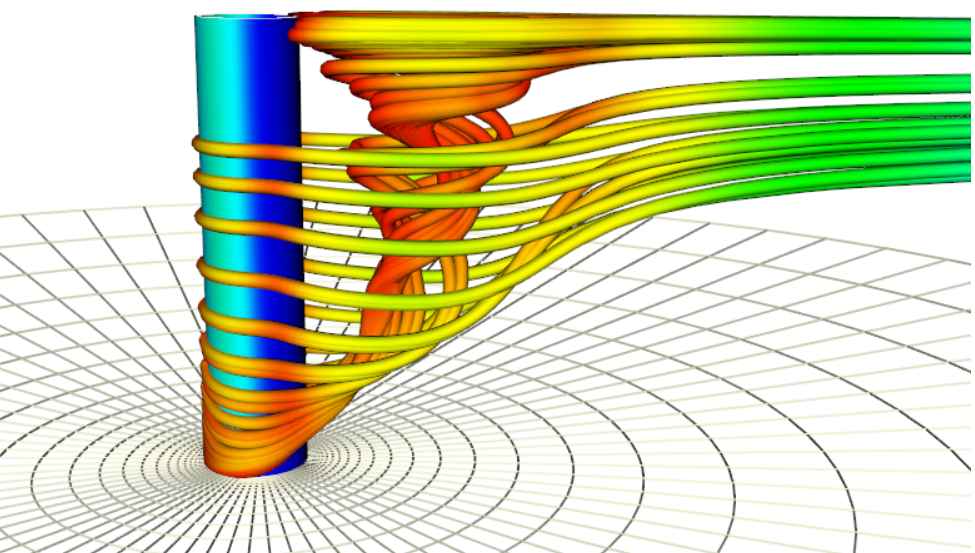
Streamlines (e.g., flow visualization in fluid dynamics).
Heatmaps and scalar fields.
Supports both 2D and 3D visualization.
Volume Rendering
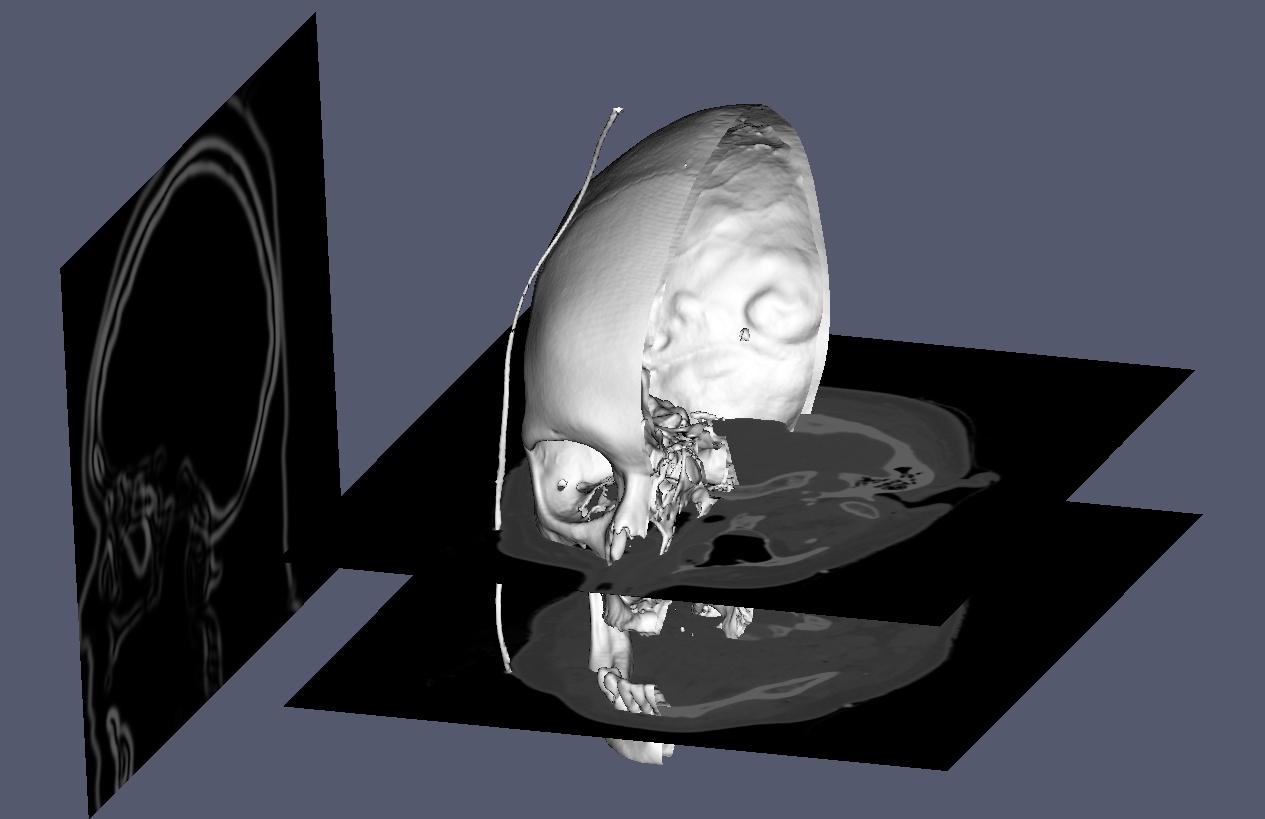
Render volumetric data, such as medical imaging (e.g., CT or MRI scans).
Handle datasets with scalar or vector fields in multiple dimensions.
Mesh Generation and Processing
Create and manipulate 3D geometries.
Perform operations like smoothing, decimation, subdivision, and clipping.
Analyze meshes for attributes like connectivity, curvature, or volume.
Simulation and Computational Analysis
Integrate with simulation workflows to visualize finite element analysis (FEA) or computational fluid dynamics (CFD) results. Create animations of simulation data over time.
Image Processing
Apply image processing techniques such as filtering, thresholding, and segmentation.
Convert 2D images into 3D models (e.g., medical imaging).
Interactivity
Build interactive applications for exploring 3D data.
Respond to user input, allowing real-time exploration of datasets.
Some examples
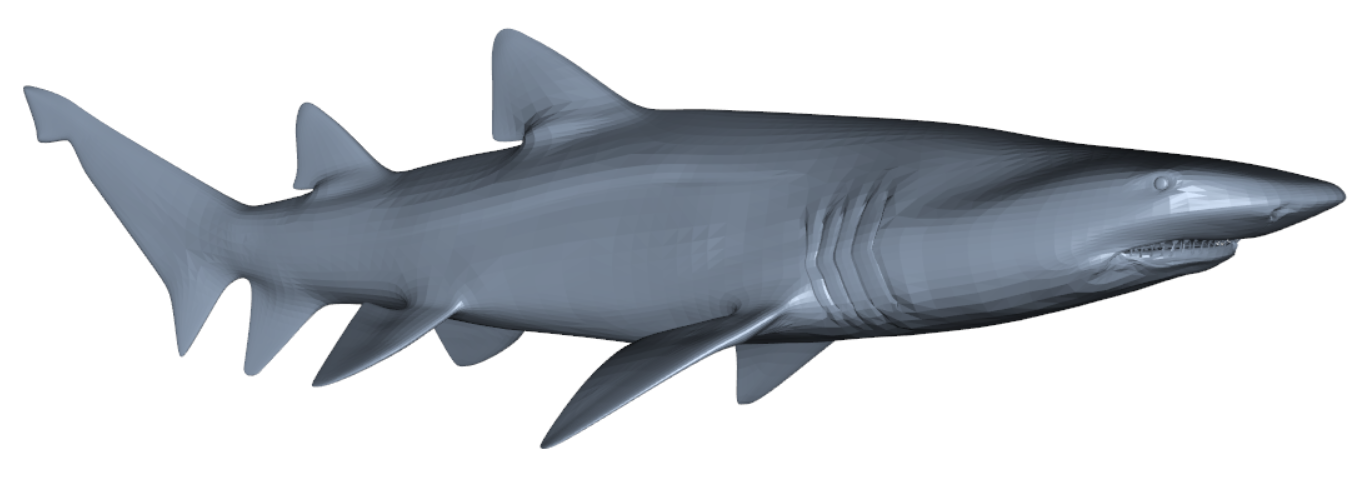
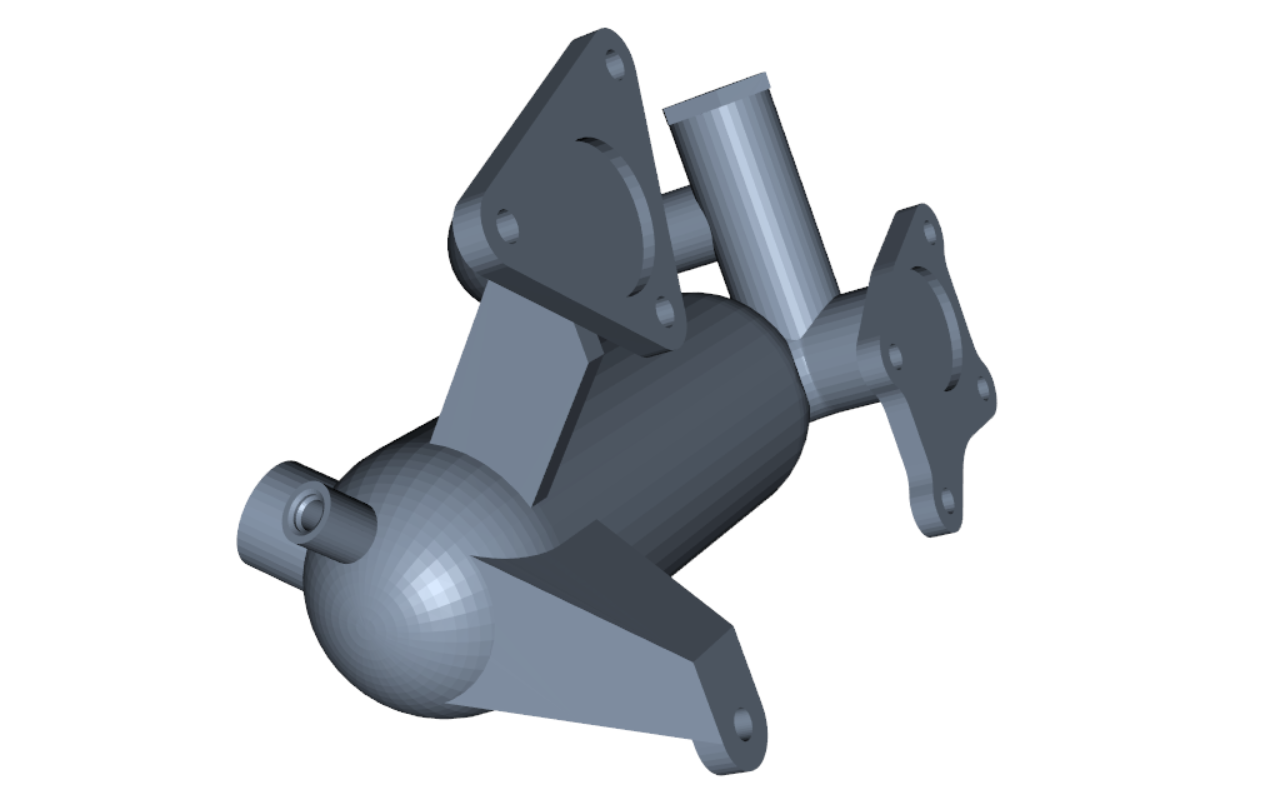
• rendering graphical 3D models (imported from .stl, .ply, .obj, etc)
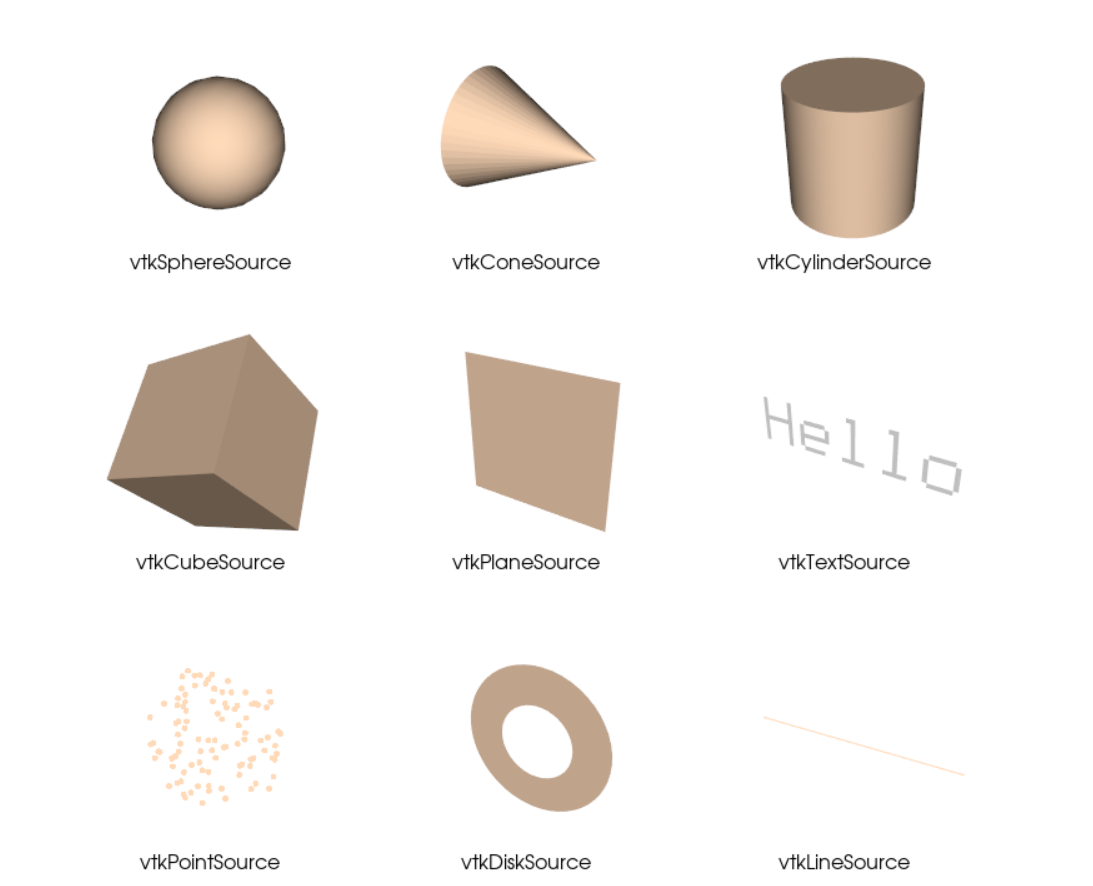
• rendering basisc 2D/3D shapes
• volume rendering used to visualize 3D scalar fields, such as medical scans (CT/MRI data).
• streamline visualization can be used to visualize flow fields (e.g., airflow around an object)
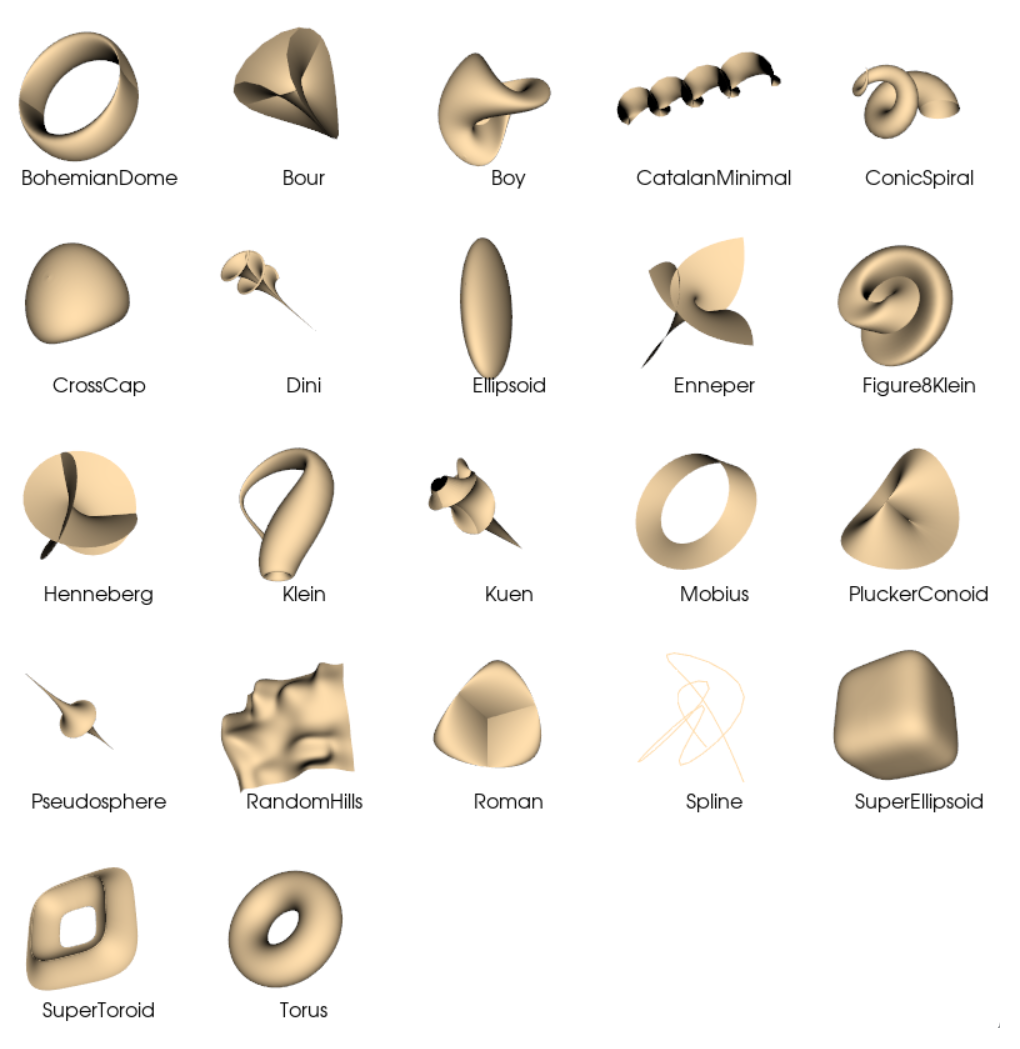
• creating parametric Objects
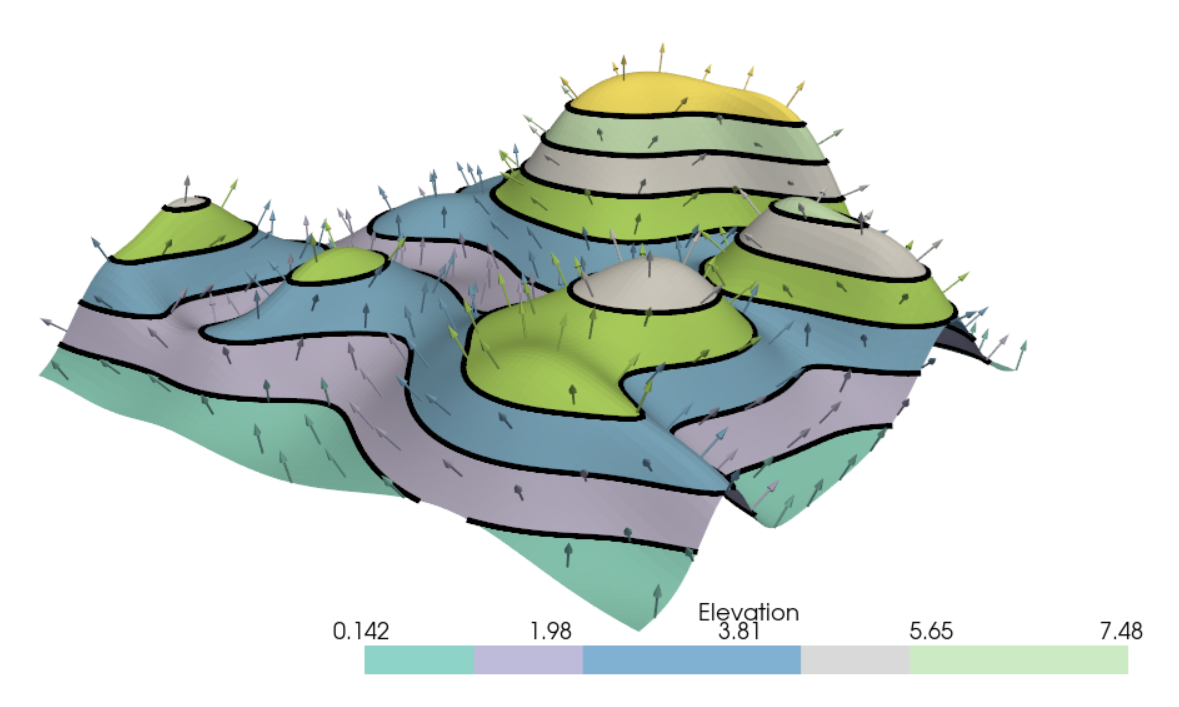
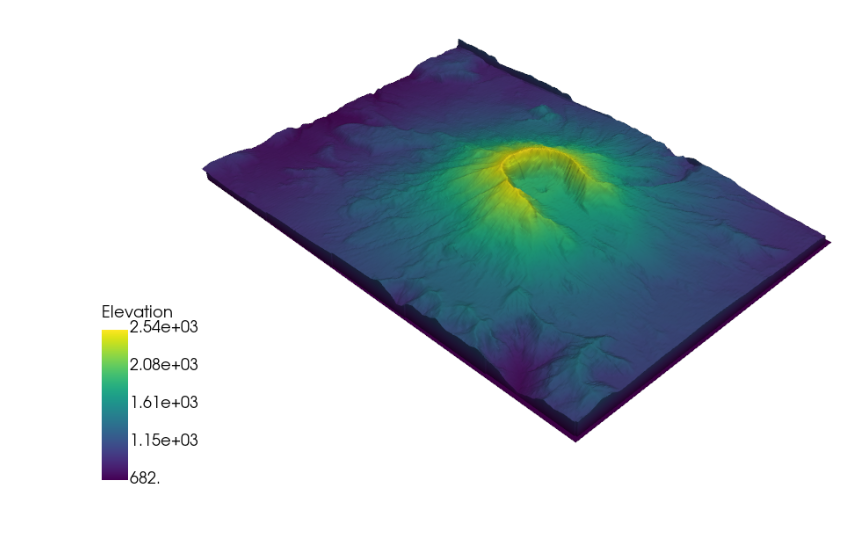
• heightmaps representing elevations in a three-dimensional space. It's often used in computer graphics, geographic information systems (GIS), and game development to create terrains or other 3D surfaces.
• surface and contours