Definition
Matplotlib is a Python 2D plotting library which produces publication quality figures in a variety of hardcopy formats and interactive environments across platforms. Matplotlib can be used in Python scripts
"Matplotlib tries to make easy things easy and hard things possible"
Website
https://matplotlib.org/
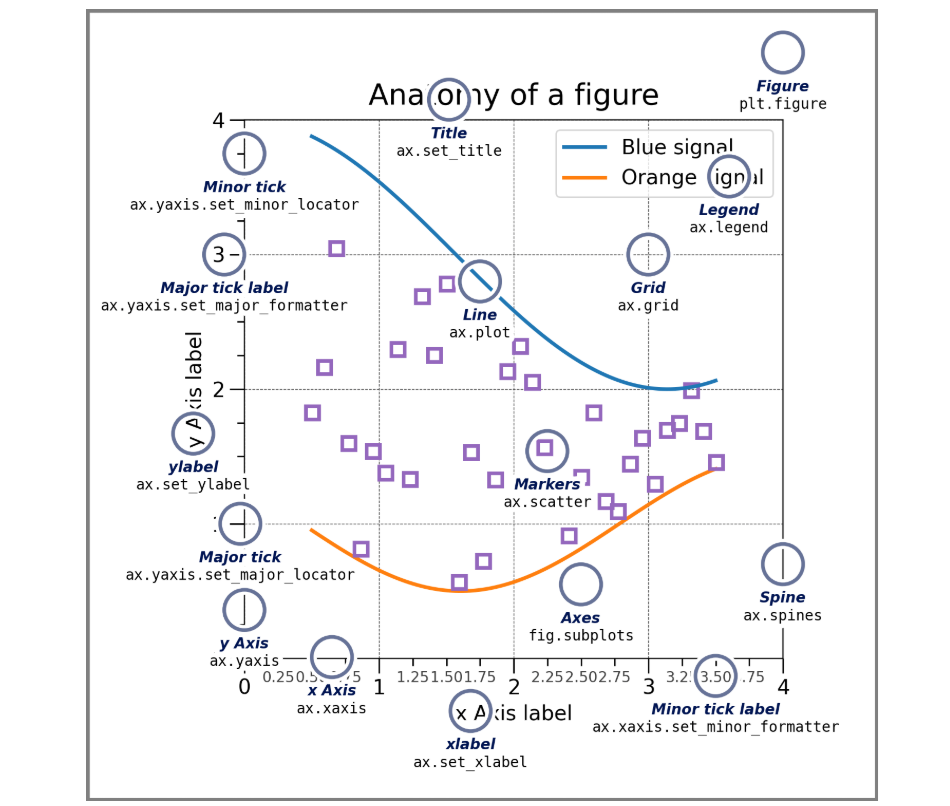
Concept of Matplotlib
• figure
• axes
• xaxis
• yaxis
• tick
• ticklabel
• xlabal, ylabel
• grid
• legend
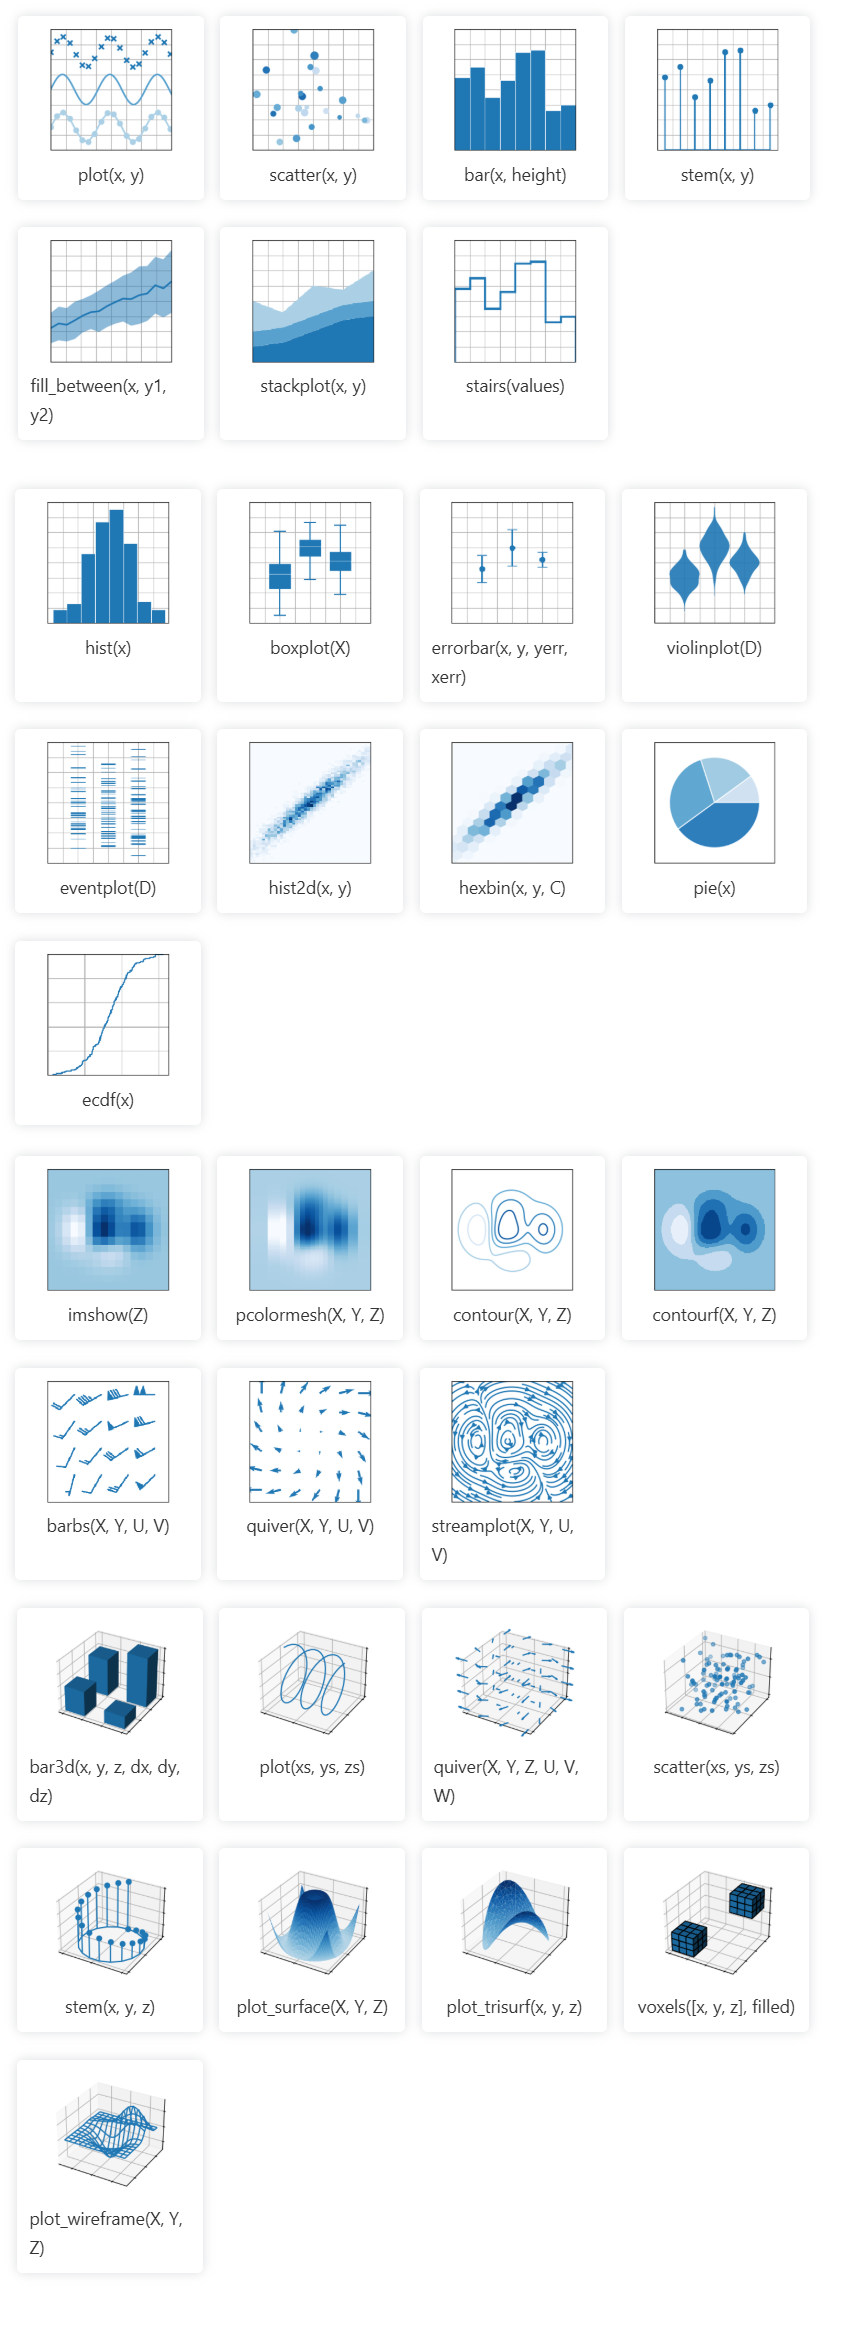
Types of plots
Colors
Matplotlib recognizes the following formats to specify a color:
• RGB or RGBA tuple of float values in [0, 1]
color = (0.1, 0.2, 0.5); color = (0.1, 0.2, 0.5, 0.3)
• a hex RGB or RGBA string e.g.,
color='0F0F0F'; color='0F0F0F0F'
• a string representation of a float value in [0, 1]} inclusive for gray level
color='0.5'
• one of
'b', 'g', 'r', 'c', 'm', 'y', 'k', 'w'