Figure
In Matplotlib, the figure is the overall container that holds all the elements of a plot, such as axes, labels, titles, and legends. The figure size refers to the dimensions of the figure in inches and is defined by two parameters: width and height. These values can be set when creating a figure using the plt.figure(figsize=(width, height) ) function, where the width and height are measured in inches. For instance, figsize=(10, 6) creates a figure 10 inches wide and 6 inches tall.
import matplotlib.pyplot as plt
fig = plt.figure(figsize=(8, 6))
plt.savefig("filename.png")
DPI
DPI stands for Dots Per Inch, which is a measure of image resolution. In the context of Matplotlib, DPI refers to how many dots (or pixels) will fit in each inch of the output image. A higher DPI value results in a sharper image with more detail, whereas a lower DPI value will create a lower-quality, pixelated image.
import matplotlib.pyplot as plt
fig = plt.figure(figsize=(8, 6))
plt.savefig("filename.png", dpi=300)
Formats
The output of the figure can be saved in various formats, such as PNG, PDF, SVG, or EPS, using the savefig() function. Each format has its use case, with PNG being widely used for web and presentations, while PDF and EPS are preferred for high-quality printing and publications.
import matplotlib.pyplot as plt
fig = plt.figure(figsize=(8, 6))
plt.savefig("filename.pdf")
plt.savefig("filename.eps")
Setup suitable for scientific publication
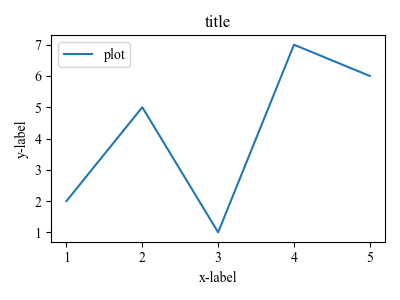
To ensure the figure is suitable for scientific publication, it's crucial to define the correct resolution and font size. For high-quality images, a dpi of 300 is recommended. Additionally, you can adjust the font size of titles, labels, and legends by specifying the fontsize parameter within plot functions.
import matplotlib.pyplot as plt
plt.rcParams["font.family"] = "Times New Roman"
plt.rcParams["font.size"] = 12
fig = plt.figure(figsize=(4, 3))
ax = fig.add_subplot(111)
x = [1,2,3,4,5]
y = [2,5,1,7,6]
ax.plot(x,y, label="plot")
ax.set_xlabel("x-label")
ax.set_ylabel("y-label")
ax.set_title("title")
ax.legend()
plt.tight_layout()
plt.savefig("../../data/example_article/filename.pdf")

Here is the figure embedded in the sample article.