What is Visualisation?
Visualisation
• to form a mental vision, image or picture of something not visible or preset to the esight, or of an abstraction
• to make visible to the mind of imagination

What is Scientific Visualisation?
Scientific Visualisation is a specialized subset of visualization focused on the visual representation of scientific data. Today, visualization primarily involves creating digital images. We really don’t care how we get the picture in visualization – what picture we get is most important
The goals of visualisation
• to explore, discover patterns and insights
• to analyze, gain a deeper understanding
• to present, communicate findings effectively
Exploratory visualization is used to delve into data sets to uncover patterns, trends, and relationships that are not immediately obvious. This type of visualization helps in the initial stages of data analysis where the objective is to understand the data better.
Analytical visualization is used to perform a detailed examination of data to draw specific conclusions, validate hypotheses, and make informed decisions. This involves more rigorous analysis and often incorporates statistical methods.
Presentational visualization is designed to communicate data findings and insights clearly and effectively to a specific audience. The focus is on clarity, simplicity, and impact, making complex data accessible and understandable.
Examples:
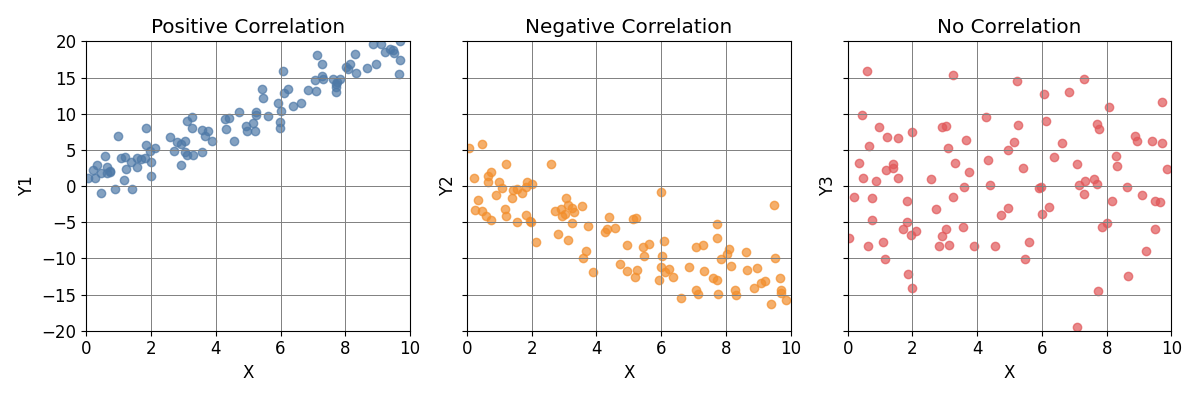
• Scatter plots to identify correlations between variables.
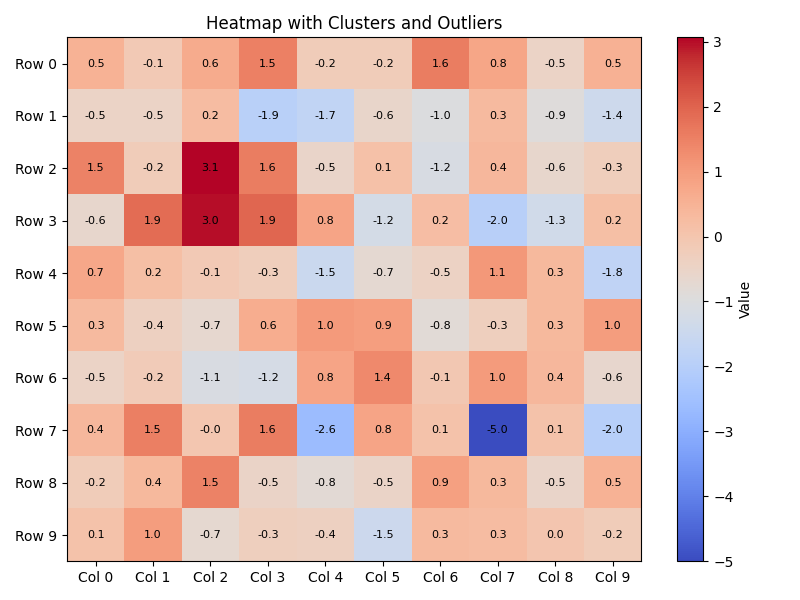
• Heat maps to find clusters or outliers.
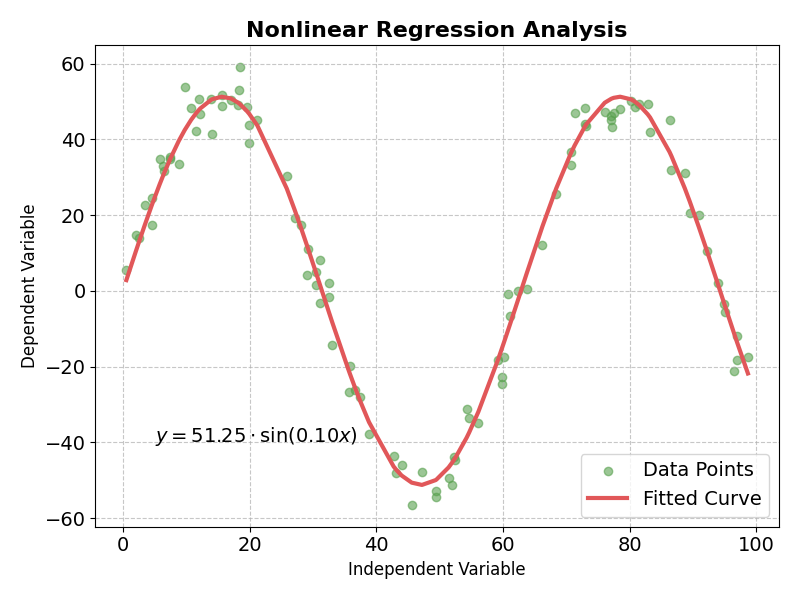
• Regression analysis plots to understand relationships between variables.
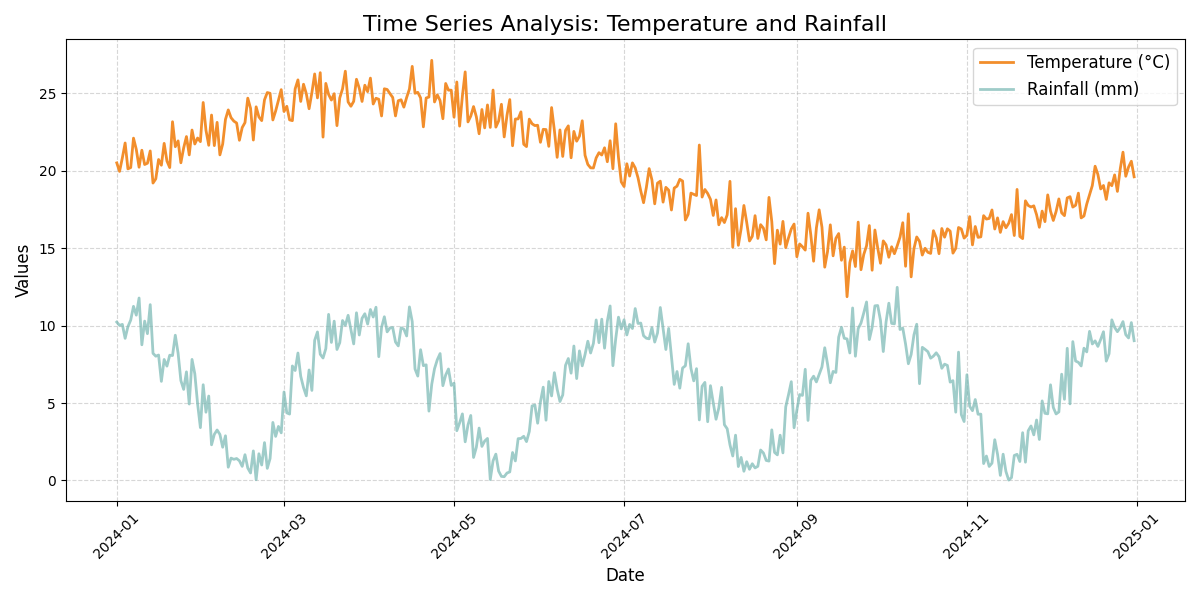
• Time series plots to analyze trends and patterns over time.
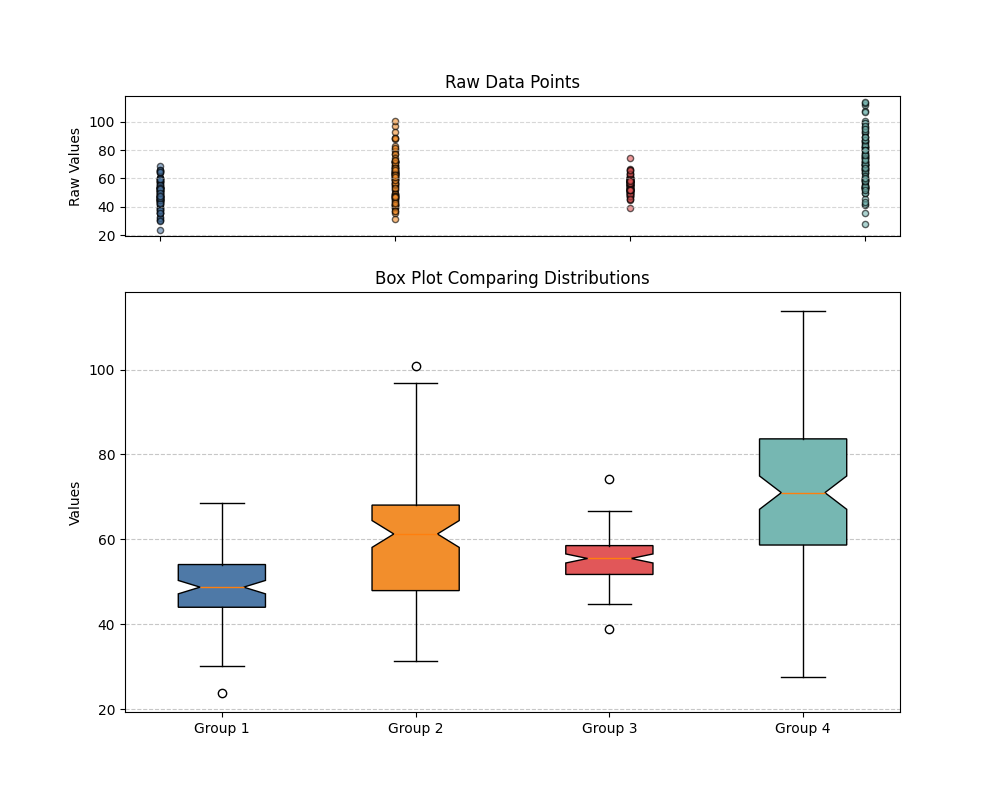
• Box plots to compare distributions and identify anomalies.
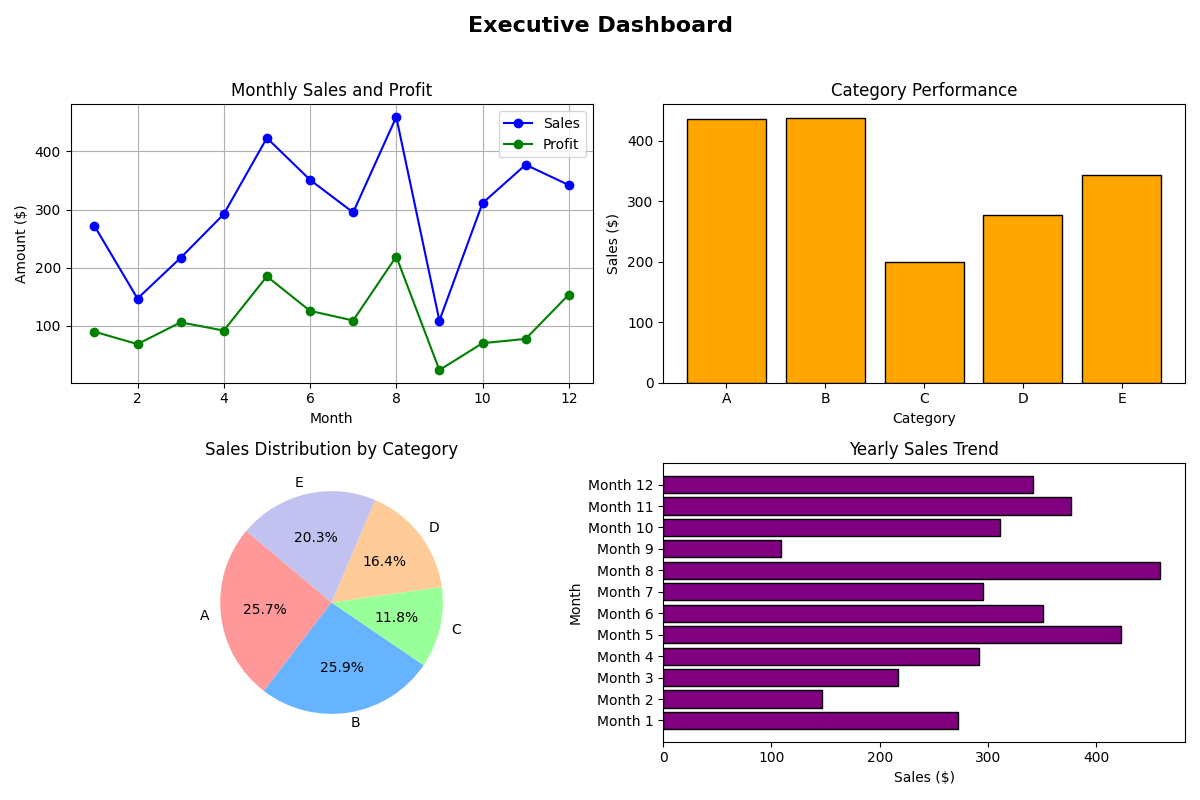
• Dashboards that provide at-a-glance summaries for executives.
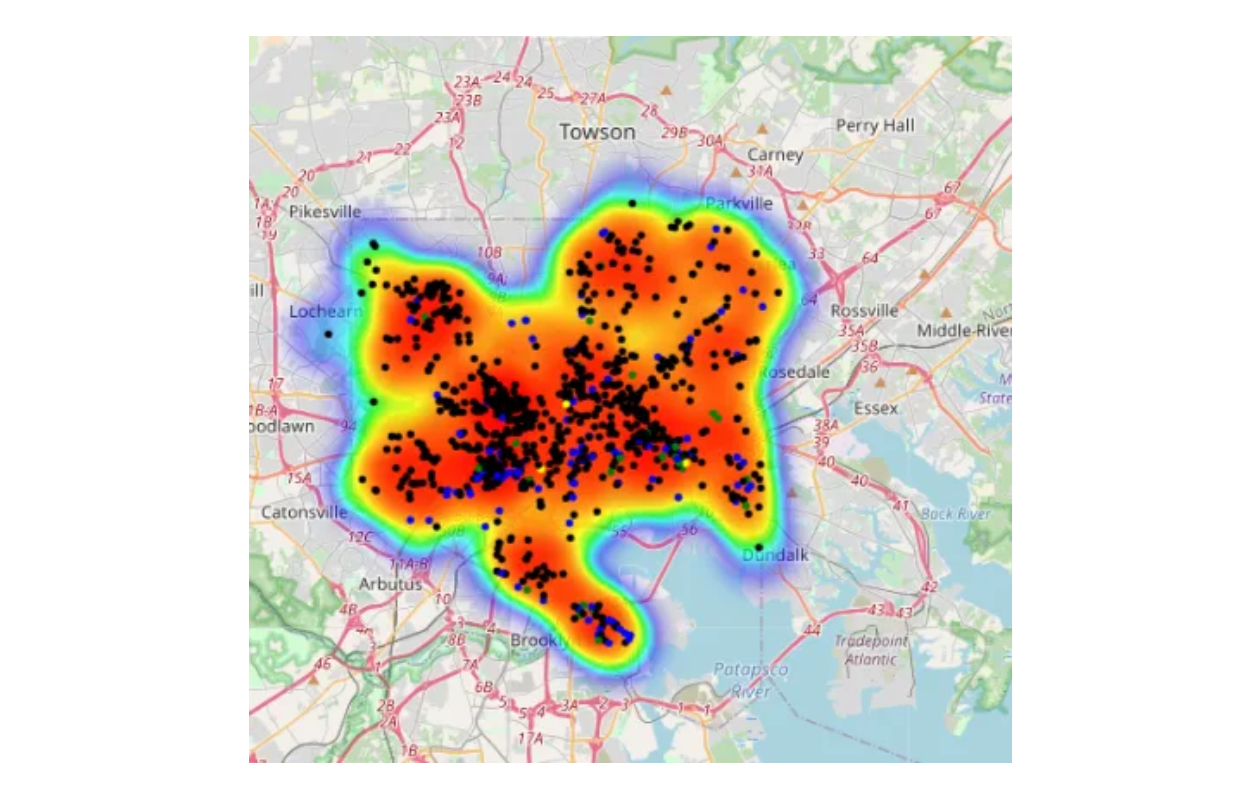
• Geographic data (folium)
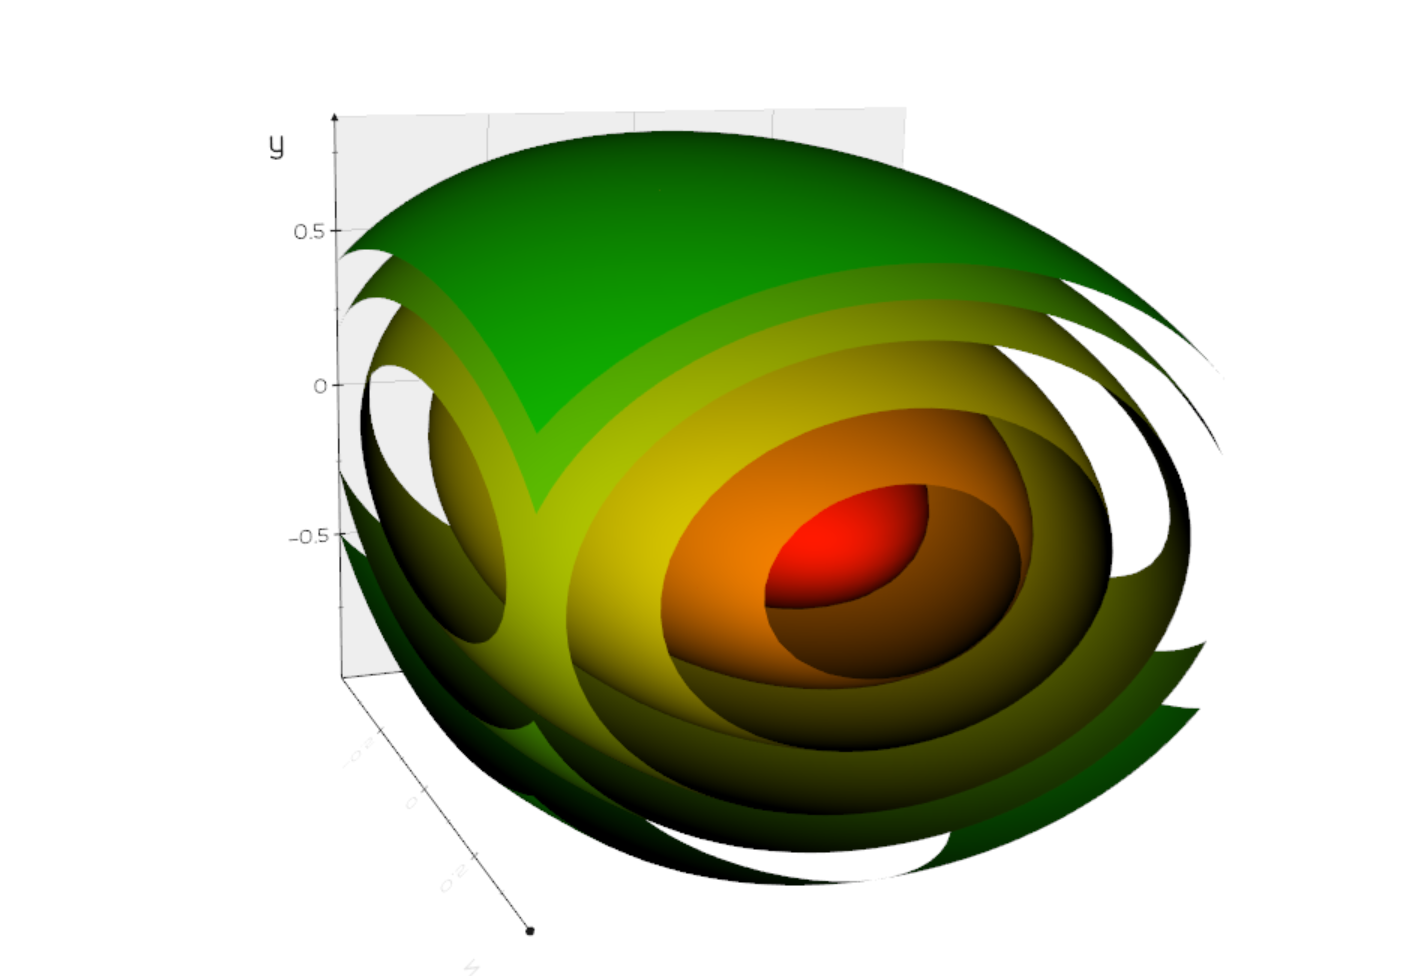
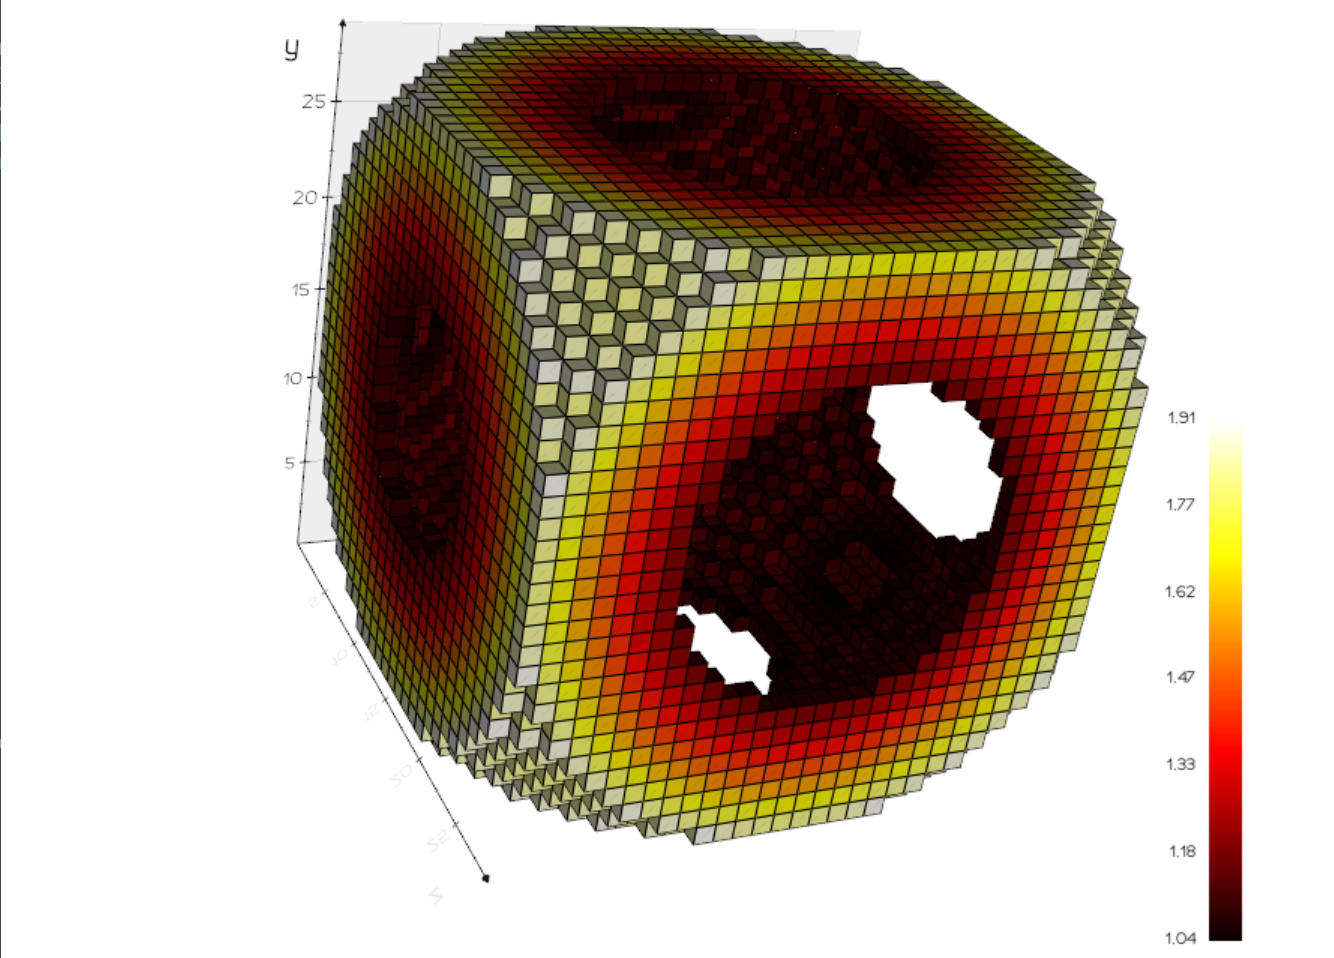
• Volumetric rendering (voxels) using vedo
• Isosufrace - The purpose of visualizing an isosurface is to provide insight into 3D scalar fields or volumetric data by representing regions where the scalar value is constant.