Definition
Matplotlib is a Python 2D plotting library which produces publication quality figures in a variety of hardcopy formats and interactive environments across platforms. Matplotlib can be used in Python scripts
"Matplotlib tries to make easy things easy and hard things possible"
Website
https://matplotlib.org/
Versions
1.0 - August 15, 2011\\
1.3 - July 31, 2014\\
1.5 - October 30, 2015 \\
2.0 - January 17, 2017
What we need to start with Matplotlib
• computer with Windows, Linux or MacOS
• PYTHON interpreter
• text editor with syntax highlighting
• Matplotlib library
• basic knolage of PYTHON language - class, functions, data types
Pyton in a nutshell
Basic data types:
• bool
a = True; a = False
• interger
a = 1; a = -23}
• float a = 0.71; a = -241.0}
• string a = 'ippt pan'; a="matplotlib"}
• list a = [1, 2.3, 'abc']}
• tuple a = (1, 2.3, 'abc')}
Matplotlib recognizes the following formats to specify a color:
• RGB or RGBA tuple of float values in [0, 1]
color = (0.1, 0.2, 0.5); color = (0.1, 0.2, 0.5, 0.3)
• a hex RGB or RGBA string e.g.,
color='0F0F0F'; color='0F0F0F0F'
• a string representation of a float value in [0, 1]} inclusive for gray level
color='0.5'
• one of
'b', 'g', 'r', 'c', 'm', 'y', 'k', 'w'
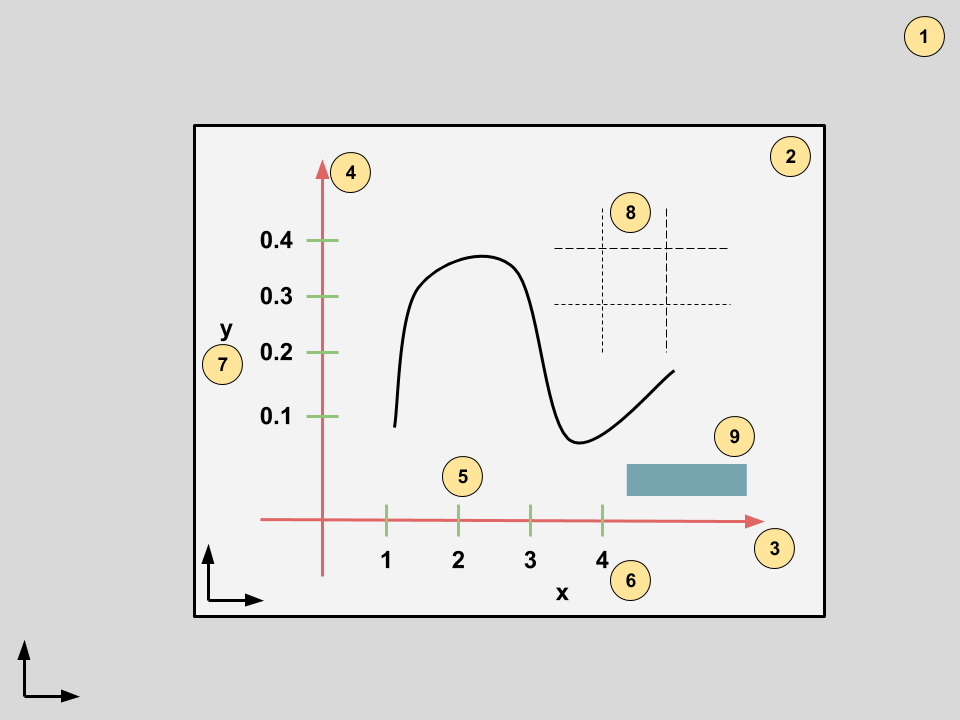
Concept of Matplotlib
• figure
• axes
• xaxis
• yaxis
• tick
• ticklabel
• xlabal, ylabel
• grid
• legend
Figure
Create the figure
figsize - size of the figure
dpi - dot per inch
facecolor - background color of the figure
Save the figure to the file
fig.savefig('path/to/the/file')
Show the figure(s)
plt.show()
# Example
e01.py

Axes
Add the axes to the figure
ax = fig.add_axes([x0, y0, w, h])}
x0 - x-coordinate of left bottom corner
y0 - y-coordinate of left bottom corner
w - width
h - height
ax = fig.add_subplot(abc)
a - number of rows
b - number of columns
c - number of the axes
Set the background color
ax.set_facecolor('red')
# Example
\begin{frame}
\frametitle{Example e03.py}
\begin{columns}
\begin{column}{6cm}
\pythonexternal{examples/e03.py}
\end{column}
\begin{column}{5cm}
\includegraphics[scale=0.25]{examples/e03.png}
\end{column}
\end{columns}
\end{frame}
\begin{frame}
\frametitle{Example e04.py}
\begin{columns}
\begin{column}{6cm}
\pythonexternal{examples/e04.py}
\end{column}
\begin{column}{5cm}
\includegraphics[scale=0.25]{examples/e04.png}
\end{column}
\end{columns}
\end{frame}
\begin{frame}
\frametitle{Axes spines}
\vspace{0.5cm}
Axes spines names: 'left','right','bottom','top'}
\vspace{0.3cm}
Spine position is specified by a 2 tuple of (position type, amount). The position types are:
\begin{itemize}
'outward'} : place the spine out from the data area by the specified number of points. (Negative values specify placing the spine inward.)
'axes'} : place the spine at the specified Axes coordinate (from 0.0-1.0).
'data'} : place the spine at the specified data coordinate.
\end{itemize}
\vspace{0.3cm}
Settings\\
ax.spines[name].set_visible(bool)}\\
ax.spines[name].set_color(color)}\\
ax.spines[name].set_linewidth(float)}
\end{frame}
\begin{frame}
\frametitle{Example e05.py}
\begin{columns}
\begin{column}{7cm}
\pythonexternal{examples/e05.py}
\end{column}
\begin{column}{4cm}
\includegraphics[scale=0.2]{examples/e05.png}
\end{column}
\end{columns}
\end{frame}
\begin{frame}
\frametitle{Ticks and ticks labels}
Set the position of the xticks\\
ax.xaxis.set_ticks_position(position)}\\
position: 'bottom' | 'top' | 'both'\\
\vspace{0.5cm}
Set the position of the yticks\\
ax.yaxis.set_ticks_position(position)}\\
position: 'left' | 'right' | 'both'\\
\vspace{0.5cm}
Ticks parameters:
\begin{itemize}
pad, distance in points between tick and label
direction, ('in', 'out')}
length, in points
width, in points.
color, accepts any mpl color spec.
labelsize, (in points)
labelcolor, accepts any mpl color spec.
\end{itemize}
\end{frame}
\begin{frame}
\frametitle{Example e06.py}
\begin{columns}
\begin{column}{7cm}
\pythonexternal{examples/e06.py}
\end{column}
\begin{column}{4cm}
\includegraphics[scale=0.2]{examples/e06.png}
\end{column}
\end{columns}
\end{frame}
\begin{frame}
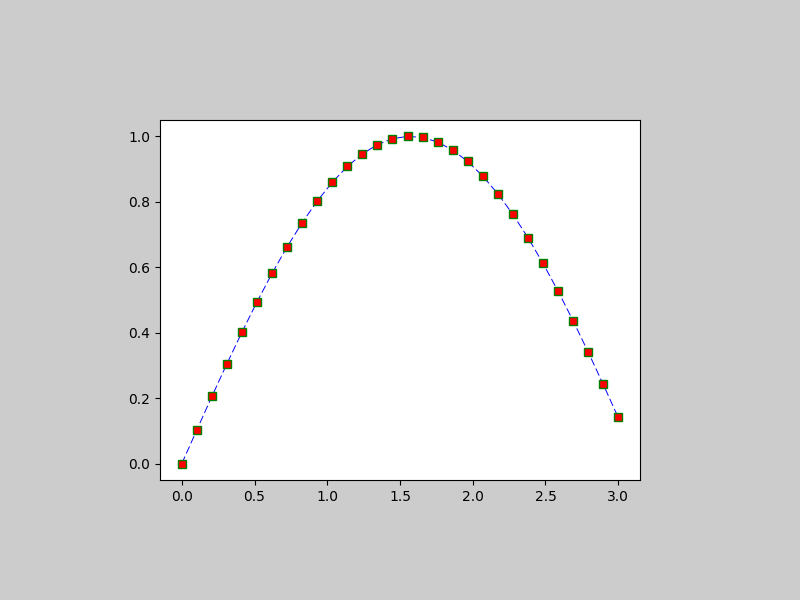
\frametitle{Plot}
Plot lines and/or markers to the Axes. args is a variable length argument, allowing for multiple x, y pairs with an optional format string. For example, each of the following is legal:\\
\vspace{0.5cm}
ax.plot(x, y)}\\
ax.plot(y)}\\
\vspace{0.5cm}
Main parameters:
\begin{itemize}
linewidth, float
linestyle, string
marker, string
markersize, float
markercolor, any mpl color
color, any mpl color
\end{itemize}
\end{frame}
\begin{frame}
\frametitle{Plot - markers}
\includegraphics[scale=0.7]{markers2.png}
\end{frame}
\begin{frame}
\frametitle{Plot - markers}
\includegraphics[scale=0.7]{markers.png}
\end{frame}
\begin{frame}
\frametitle{Plot - linestyle}
\includegraphics[scale=0.7]{lines.png}
\end{frame}
# Example
examples/e07.py}